Category: Insights

  • SPY vs QQQ: Understanding the Difference

    SPY vs QQQ: Understanding the Difference

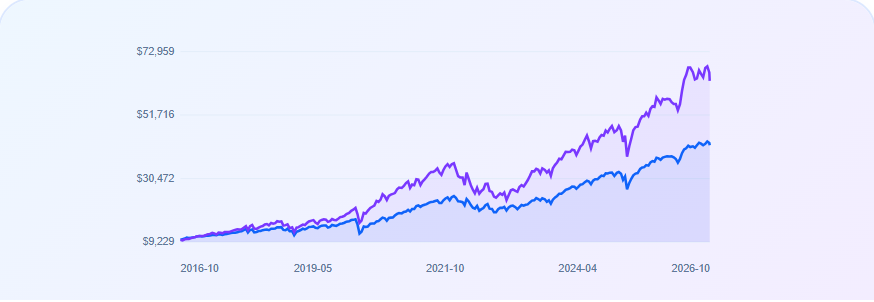
    SPY and QQQ are exchange-traded funds with different index objectives. Comparing their names or recent returns alone does not explain what you own.

    What each fund tracks

    SPY seeks to track the price and yield performance of the S&P 500 before expenses. QQQ tracks the Nasdaq-100, an index of large non-financial companies listed on Nasdaq. These are different investment universes, so their holdings and sector exposures can differ.

    Sources: State Street SPY fund information and Invesco QQQ fund information. Review the current holdings and prospectus before investing.

    Look for overlap

    Owning both funds does not automatically create two independent sources of diversification. Check whether the same companies appear in both and how much of your combined portfolio they represent. Holdings and weights change over time.

    Set up a fair historical comparison

    Use the same starting amount and requested dates for each ETF. Inspect the actual price dates in the results, especially around weekends and holidays. Compare final value, total return, annualized return, and maximum drawdown together.

    Confirm whether a calculation uses price returns or adjusted historical prices, and how it treats distributions. A historical price series is not a complete reconstruction of your brokerage experience, taxes, transaction costs, or execution prices.

    Try the comparison

    Compare SPY and QQQ in the ETF comparison tool → Select the two funds and your dates. This article does not declare a winner or present a verified backtest.

    Methodology

    This is a conceptual fund comparison based on the issuers’ descriptions, not a performance study. No historical return chart or forecast has been estimated for this article. Past performance does not establish future results.
  • DCA vs Lump Sum: How They Work

    DCA vs Lump Sum: How They Work

    Lump-sum investing puts an available amount to work at one time. Dollar-cost averaging (DCA) spreads investment purchases across a regular schedule.

    How regular investing works

    With a fixed contribution, a lower purchase price buys more shares and a higher price buys fewer. The SEC’s Investor.gov definition of dollar-cost averaging describes investing equal portions at regular intervals regardless of market movements.

    Separate two different situations

    Investing money as you earn it differs from deliberately holding back money that is already available. In the first case, future contributions cannot be invested today. In the second, a comparison must account for the uninvested cash while purchases are phased in.

    Keep the comparison fair

    Use the same asset, overall period, and total available funding. Specify the initial investment, contribution amount, frequency, and purchase-date rules. Record what happens to cash before it is invested. Different contributions can produce a larger ending balance without demonstrating a better investment return.

    For recurring contributions, annualized money-weighted return, when available, reflects cash-flow timing. It should not be confused with simply dividing the gain by the initial deposit or with the asset’s price CAGR.

    Try your schedule

    Calculate DCA Returns → Enter your starting investment and recurring contribution. Review total invested alongside ending value and the actual dates used. DCA Portfolio can explore allocations across multiple assets.

    What this article does not establish

    Neither approach removes investment risk. Regular purchases do not guarantee a profit or prevent losses. This article contains no backtest claiming that one approach always wins. Historical comparisons depend on the chosen dates, asset, contributions, and treatment of cash.

    Methodology

    This educational explanation uses the SEC definition linked above. No market-return estimates are supplied; use the calculator’s disclosed historical inputs and assumptions to inspect a specific case.

  • How to Use Portfolio Stress Testing

    How to Use Portfolio Stress Testing

    A portfolio stress test asks how a chosen allocation behaves under a specified set of conditions. It is a way to examine assumptions, not a prediction of the next market event.

    Start with your allocation

    Choose the assets, investment amount, and weights. Weights should total 100%. Decide whether you are examining a one-time investment or a recurring contribution plan. A change in funding can change the ending balance independently of investment performance.

    Historical crises and custom periods

    Historical modes use the supported historical price series for the selected dates. They do not apply the AI beta formula to stocks and ETFs. Check actual coverage and the dates used for each asset. If an asset lacks history for a period, do not interpret a hypothetical fallback as observed performance.

    AI scenarios are hypothetical

    In the AI impact model, stock and ETF estimates use beta multiplied by the assumed S&P 500 change, unless a supported explicit asset shock takes priority. Crypto uses the scenario’s crypto assumption. The model estimates an impact on the current invested balance; it does not produce a verified future price path.

    Beta is an estimate from historical co-movement. It does not capture every company-specific event or guarantee the response to a future shock. A scenario about one company should not be read as an exact forecast for all of its peers.

    Read losses and assumptions together

    Compare the estimated portfolio change with the individual asset changes and their allocation weights. Historical maximum drawdown measures a decline from a prior peak; an endpoint hypothetical loss is a different quantity. Do not infer recovery time from a single assumed price change.

    Try a stress test

    Explore Portfolio Stress Test → Start with a historical scenario, review the assumptions, then change one input at a time. AI Scenario Builder lets you create and verify hypothetical market assumptions.

    Methodology and limitations

    This is a guide to the NextInvested tool’s calculation modes, not a market forecast or completed stress study. No sample losses or recovery dates have been invented. Results depend on coverage, allocation, scenario inputs, and model limitations. Review the Scenario Assumptions section before relying on an output.